 av
av Reasons To Be Cheerful (and Drear-full) About Stocks
Authored by Simon White, Bloomberg macro strategist,
While the bearish case for stocks holds sway, there are valid reason to hold the opposite view. And in the spirit of understanding we will offer both below.
First, the bear case:
It’s easy to find reasons why stocks are vulnerable.
Below are three.
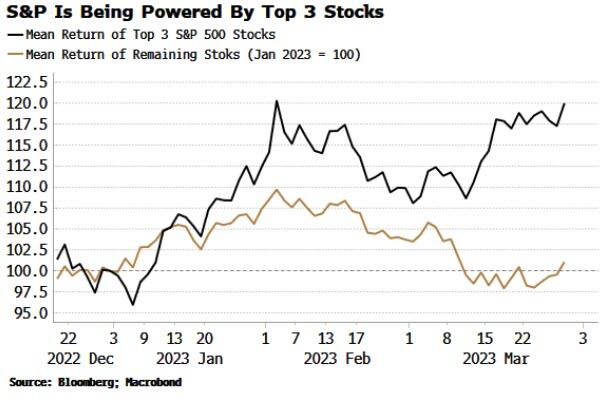
1) The S&P 500 is being driven by a very narrow band of stocks. The three biggest (Apple, Microsoft and Amazon) are up an average of ~20% while the rest of the market is flat on the year. That high-duration tech sector is leading the charge implicitly assumes that inflation is yesterday’s problem. That that is overly-optimistic.
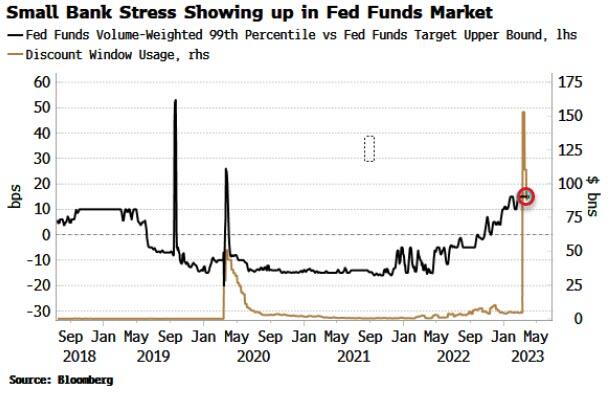
2) Banking stress has eased, not evaporated. Yesterday’s Fed balance-sheet data showed only a small fall in the RRP facility. Taken over two weeks, it has increased over $200 billion as it becomes the net repository for a chunk of the deposits leaving the banking system. It remains near the highs.
Bank-deposit data is released this evening. The signs are that we are past the acute phase of (this iteration of) the banking crisis. But there is still stress, as seen in the top-end of what some (likely smaller) banks are paying to borrow in the fed funds market.
3) On a shorter timescale, today is quarter-end option expiry, which can lead to volatility and potential downside as strategies are rolled. One large, often-discussed structure is the so-called JPM collar, that the bank has on for its Hedged Equity Fund (JHEQX).
Given its size, we can normally see it by looking at the outstanding delta of S&P option by strike. The largest call delta is at 4065 (close to the money), while the largest put delta is at 4000.
As an illustrative example, if these strikes were to be reset to 5% from yesterday’s close, that would approximate to 3850 for the puts, and 4250 for the calls. Assuming an equal-weighted collar, dealers would get net-long taking the other side (~7% net delta), implying they would need to sell to rebalance.
There are many assumptions here, but it’s worth thinking through as this collar can be market moving.
Now, let’s also consider the bull case.
Respecting the price is a mantra traders and investors learn quickly (survivorship bias), and the two bullish reasons I have do not relate to banking crises, option expiries, or anything else — just the purity of price.
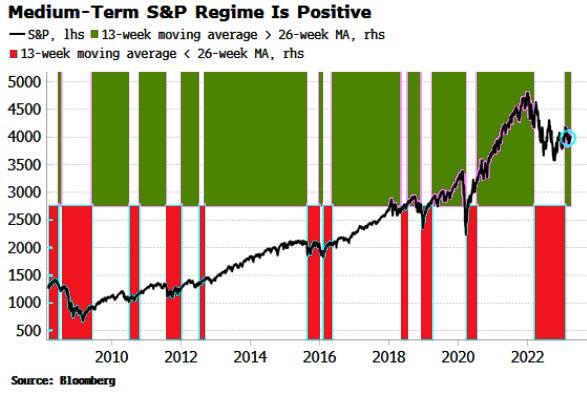
1) The first is the medium-term trend of the S&P. The green segments in the chart below show when the 13-week moving average for the market is above the 26-week average. The red segments are when it is the other way around.
Green regimes are generally associated with strong medium-term uptrends in the market, while the red regimes you’d generally want to be out of (or even short) the market. The S&P has been in a green regime since February.
No indicator is perfect, but its robustness comes from its simplicity. Lots could happen, but it makes sense to pay heed to this measure when trying to figure what the market may do over the next few months.
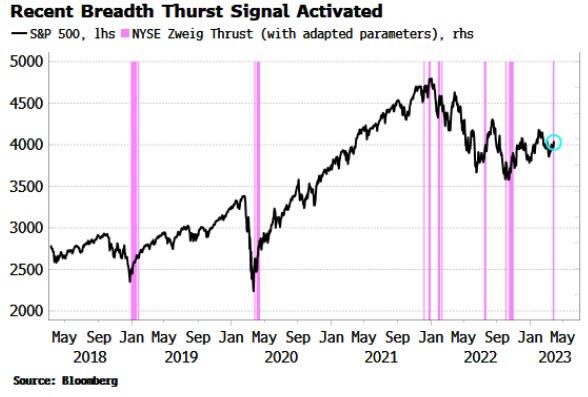
2) Second is the Zweig Thrust signal. It triggers whenever breadth (defined as the net number of stocks rising on the NYSE) rapidly goes from being very weak to very strong (i.e. “thrusts” higher).
The exact parameters can vary, and the original ones used by Zweig himself give too many false signals for my liking. I have tweaked them slightly, and on these inputs we saw one of these thrusts a few days ago.
The market on average goes on to return 1.4% over the next month, versus 0.6% for the full sample; and 3.3% over the next three months, versus 2.1% for the full sample. Over six months it’s 7.7% versus 4.1%.
In this post I looked at both sides of the argument. While I lean to the bearish camp, I can’t deny that price can create its own reality and stocks could continue rallying here.
Still, I continue to think this is a bear-market rally, and the ultimate lows still lie ahead.
Tyler Durden
Fri, 03/31/2023 – 15:05