 av
av Israel Has The World’s Highest Digital Quality Of Life In 2022, USA Only 12th
Life and work in the 21st century is increasingly reliant on modern technology, with a country’s digital quality of life playing a massive role on people’s day-to-day.
Some countries excel in internet access and affordability, while others have more modern digital systems and relevant laws. And, as Visual Capitalist’s Omri Wallach details below, many regions of the world suffer with lacking digital infrastructure and access across the board.
The 2022 Digital Quality of Life Index (DQL) from Surfshark analyzes countries on digital wellbeing, based on data from the UN, World Bank, Freedom House, and the International Communications Union.
5 Metrics for Measuring Digital Wellbeing
The DQL Index covers 117 countries with readily available data, making up 92% of the global population. Each country is scored on five pillars:
Internet Affordability—How much time people have to work to afford a stable internet connection.
Internet Quality—How fast and stable the internet connectivity in a country is and how well it’s improving.
Electronic Infrastructure—How well developed and inclusive a country’s existing electronic infrastructure is.
Electronic Security—How safe and protected people feel in a country.
Electronic Government—How advanced and digitized a country’s government services are.
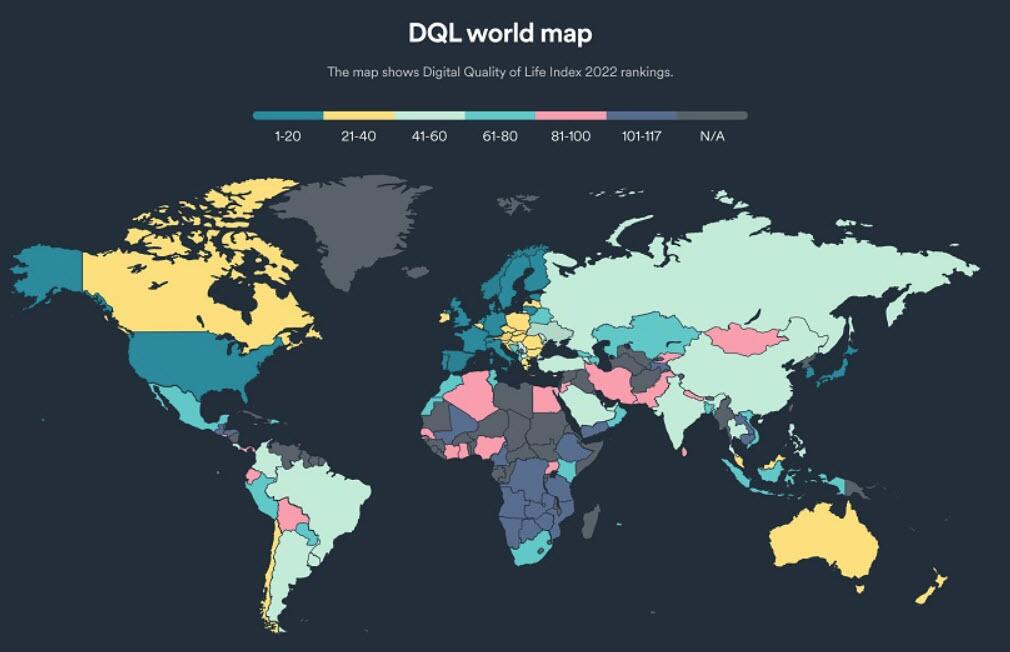
Visualizing The World’s Digital Quality of Life
Overall, Europe and Asia led the digital quality of life rankings in 2022. Israel took the top spot with an incredibly strong score in internet affordability. Here are the countries sorted by rankings and their weighted scores in each category:
Rank
Country
Affordability
Quality
E-infrastructure
E-security
E-government
1
Israel
0.1917
0.0981
0.1668
0.1503
0.1541
2
Denmark
0.047
0.1186
0.1968
0.1878
0.1844
3
Germany
0.0718
0.0926
0.1922
0.1946
0.1612
4
France
0.0534
0.111
0.1834
0.1878
0.1749
5
Sweden
0.0213
0.1059
0.1958
0.1878
0.1787
6
Netherlands
0.0241
0.0985
0.1956
0.1865
0.1796
7
Finland
0.0171
0.0973
0.192
0.1892
0.1869
8
Japan
0.0684
0.1024
0.1846
0.1462
0.177
9
U.K.
0.0413
0.0898
0.1882
0.1611
0.188
10
South Korea
0.0252
0.1139
0.1884
0.1516
0.1868
11
Lithuania
0.0508
0.087
0.1705
0.1973
0.1592
12
U.S.
0.0326
0.113
0.1944
0.1224
0.1947
13
Switzerland
0.0337
0.1114
0.1914
0.1597
0.1607
14
Estonia
0.0219
0.0759
0.1852
0.1946
0.1779
15
Singapore
0.0717
0.1134
0.1852
0.0943
0.19
16
Spain
0.0257
0.0924
0.1777
0.1919
0.1656
17
Norway
0.0136
0.0923
0.194
0.1649
0.174
18
Luxembourg
0.0272
0.0911
0.1878
0.1689
0.1597
19
Italy
0.0362
0.082
0.1733
0.1824
0.159
20
Portugal
0.0085
0.1101
0.1576
0.1932
0.1565
21
Belgium
0.0162
0.0868
0.1823
0.1973
0.1409
22
Austria
0.0279
0.0717
0.1782
0.1716
0.1719
23
Poland
0.0242
0.0869
0.1566
0.1905
0.1568
24
Ireland
0.0217
0.0874
0.1799
0.1662
0.1596
25
Czechia
0.023
0.0755
0.1707
0.196
0.1472
26
Canada
0.0228
0.0967
0.1831
0.1289
0.1723
27
Hungary
0.0206
0.1046
0.1647
0.1676
0.1425
28
New Zealand
0.0166
0.1027
0.1731
0.1341
0.1702
29
Slovakia
0.0233
0.0807
0.161
0.1865
0.1417
30
Bulgaria
0.0308
0.1025
0.1352
0.177
0.1452
31
Croatia
0.0133
0.0911
0.1625
0.1865
0.1346
32
Slovenia
0.0102
0.0934
0.1619
0.1622
0.1591
33
Latvia
0.0235
0.0918
0.1628
0.1784
0.1289
34
Romania
0.0299
0.105
0.1427
0.1743
0.1327
35
Australia
0.0453
0.0706
0.1755
0.1089
0.1802
36
Malta
0.0104
0.093
0.1639
0.1527
0.1547
37
Cyprus
0.0139
0.0718
0.1589
0.1689
0.1548
38
Malaysia
0.0319
0.0838
0.1636
0.1224
0.1561
39
Greece
0.0085
0.0713
0.142
0.2
0.1344
40
Chile
0.0251
0.1202
0.1469
0.1022
0.1538
41
Uruguay
0.0051
0.1054
0.1569
0.13
0.1498
42
Russia
0.0556
0.0794
0.1512
0.0943
0.152
43
China
0.0241
0.1045
0.1485
0.0741
0.175
44
U.A.E.
0.0071
0.1148
0.1779
0.0419
0.1712
45
Argentina
0.0073
0.0694
0.1575
0.13
0.1464
46
Qatar
0.0077
0.1077
0.1705
0.0808
0.1421
47
Armenia
0.1009
0.07
0.1356
0.0765
0.1221
48
Serbia
0.0184
0.0739
0.1387
0.1238
0.1429
49
Thailand
0.0081
0.1045
0.151
0.0876
0.1391
50
Ukraine
0.0259
0.0581
0.1613
0.1184
0.1256
51
Saudi Arabia
0.0057
0.0873
0.1635
0.0865
0.1408
52
Turkey
0.0153
0.0679
0.1526
0.0968
0.1488
53
Brazil
0.0078
0.0884
0.1388
0.0686
0.1558
54
Moldova
0.0357
0.0687
0.1359
0.0927
0.1226
55
Philippines
0.0044
0.0779
0.1371
0.1062
0.1265
56
Bahrain
0.0084
0.0878
0.166
0.047
0.1396
57
Colombia
0.0051
0.0775
0.1248
0.0954
0.1433
58
Costa Rica
0.0042
0.0721
0.1523
0.0954
0.1206
59
India
0.0266
0.071
0.1149
0.0822
0.1489
60
N. Macedonia
0.0095
0.0684
0.1409
0.0981
0.1237
61
Kazakhstan
0.0185
0.0639
0.1408
0.07
0.1473
62
Mexico
0.0111
0.0688
0.1291
0.0792
0.142
63
Paraguay
0.0091
0.0724
0.1424
0.0862
0.113
64
Albania
0.0087
0.0567
0.1313
0.09
0.1328
65
Oman
0.0053
0.065
0.1455
0.0473
0.1502
66
South Africa
0.0198
0.0689
0.1171
0.0778
0.1294
67
Georgia
0.0097
0.0577
0.1408
0.0941
0.1103
68
Mauritius
0.0149
0.0459
0.1311
0.09
0.1298
69
Belarus
0.0224
0.068
0.1396
0.0554
0.123
70
Vietnam
0.0145
0.0712
0.1396
0.0578
0.1241
71
Morocco
0.0068
0.0603
0.1247
0.113
0.1004
72
Indonesia
0.0064
0.0639
0.1382
0.0605
0.1342
73
Peru
0.0037
0.069
0.126
0.0819
0.1213
74
Azerbaijan
0.0093
0.0618
0.1361
0.0592
0.1253
75
Montenegro
0.0149
0.0566
0.1339
0.0765
0.1064
76
Bangladesh
0.024
0.0681
0.1204
0.0703
0.1021
77
Tunisia
0.011
0.0484
0.1225
0.0886
0.1142
78
Kenya
0.0047
0.0492
0.1391
0.0714
0.1193
79
Dominican Republic
0.0047
0.0597
0.1163
0.0754
0.1229
80
Bosnia and Herzegovina
0.0127
0.0634
0.1353
0.0697
0.0974
81
Panama
0.0032
0.0851
0.1279
0.05
0.1111
82
Ecuador
0.0045
0.0656
0.132
0.0365
0.1256
83
Trinidad and Tobago
0.0094
0.0622
0.1277
0.0551
0.1074
84
Iran
0.0149
0.0585
0.1482
0.0149
0.1113
85
Egypt
0.0064
0.0583
0.1098
0.0595
0.1135
86
Nigeria
0.0014
0.0552
0.1187
0.0768
0.0916
87
Jordan
0.0048
0.0754
0.1434
0.0297
0.0862
88
Ghana
0.0025
0.0531
0.0957
0.0724
0.1091
89
Sri Lanka
0.0071
0.0658
0.0943
0.0446
0.1184
90
Mongolia
0.015
0.059
0.135
0.0189
0.0951
91
Kyrgyzstan
0.0105
0.0603
0.0986
0.0457
0.1074
92
Algeria
0.005
0.0601
0.1312
0.0551
0.0707
93
Bolivia
0.0051
0.0583
0.1287
0.0324
0.0941
94
Nepal
0.0069
0.0684
0.1132
0.0497
0.0762
95
Senegal
0.0036
0.055
0.1048
0.0603
0.0906
96
Pakistan
0.006
0.0616
0.0938
0.0446
0.1015
97
Jamaica
0.0047
0.0584
0.113
0.0432
0.0859
98
Uganda
0.0007
0.0489
0.0777
0.0768
0.0943
99
El Salvador
0.0028
0.0662
0.1066
0.0257
0.0944
100
Ivory Coast
0.0006
0.0465
0.0881
0.0724
0.0869
101
Cambodia
0.0043
0.0631
0.1178
0.0162
0.0831
102
Mali
0.0011
0.0548
0.0969
0.0603
0.0689
103
Namibia
0.0046
0.0517
0.0955
0.0322
0.0899
104
Guatemala
0.0029
0.059
0.0877
0.0257
0.0878
105
Zambia
0.0034
0.0241
0.0935
0.0781
0.0613
106
Botswana
0.0051
0.0523
0.0977
0.023
0.0777
107
Tanzania
0.0021
0.0517
0.0813
0.0257
0.0924
108
Honduras
0.004
0.0675
0.0838
0.0108
0.0861
109
Zimbabwe
0.0019
0.034
0.0907
0.0362
0.0854
110
Angola
0.0047
0.0567
0.0576
0.0495
0.0748
111
Laos
0.0066
0.0489
0.0955
0.0189
0.059
112
Tajikistan
0.0108
0.0485
0.073
0.0108
0.0754
113
Cameroon
0.0014
0.0178
0.073
0.0338
0.0832
114
Mozambique
0.0021
0.0378
0.0526
0.0295
0.0815
115
Ethiopia
0.0032
0.0472
0.048
0.0338
0.0682
116
Yemen
0.007
0.0644
0.0479
0.0081
0.0527
117
Congo DR
0.0063
0.0596
0.0446
0.0027
0.0394
Overall, 15 of the top 20 highest-scoring countries were located in Europe, including #2 Denmark and #3 Germany, reflecting the region’s strong scores in electronic infrastructure and security.
In addition to Israel, the Asia region was represented at the top by #8 Japan, #10 South Korea, and #15 Singapore. The only non-Asian and non-European country to make the top 20 was the United States at #12.
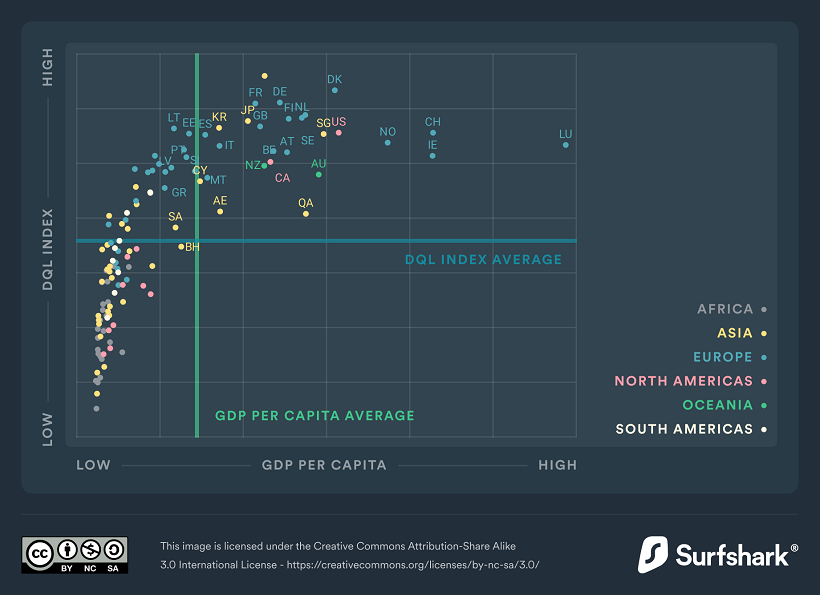
GDP’s Impact on Digital Infrastructure
Of the 117 countries that had data available for the index, the majority of the lowest-ranking countries were in Africa or Asia. This includes the bottom five: Cameroon, Mozambique, Ethiopia, Yemen, and DR Congo.
In fact, when the DQL Index was charted against GDP per capita, a clear and unsurprising trend emerges:
As countries have to grapple with limited resources and capital for increasing their digital wellbeing, we can see different priorities emerge. For example. many countries scored poorly on internet affordability and electronic government while prioritizing investments in internet quality and electronic infrastructure.
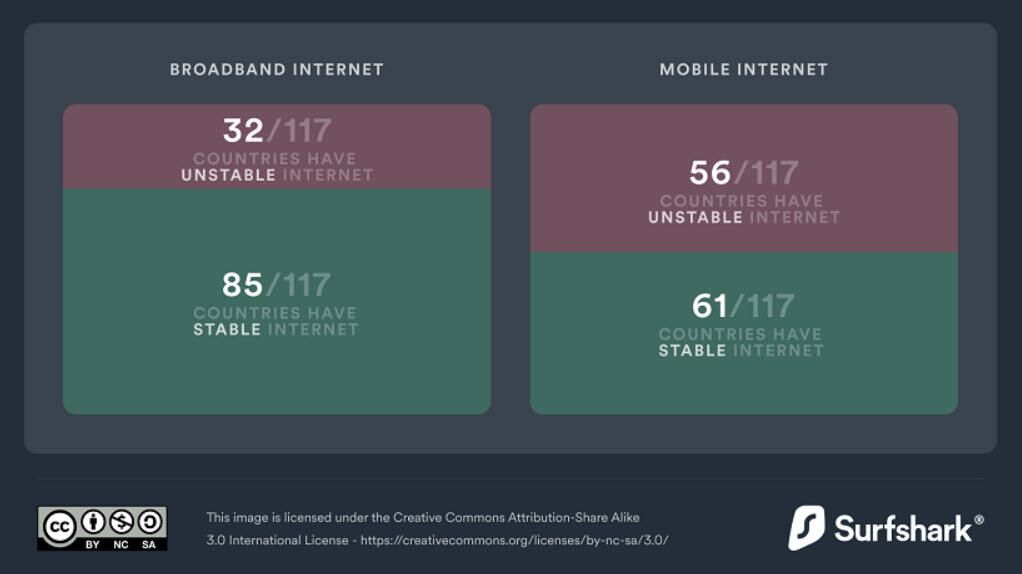
And despite the proliferation of mobile phones across the world, more countries were able to set up stable broadband internet over mobile internet.
To find out more interesting insights, dive in to the full Digital Quality of Life Index.
Tyler Durden
Sun, 01/01/2023 – 20:15